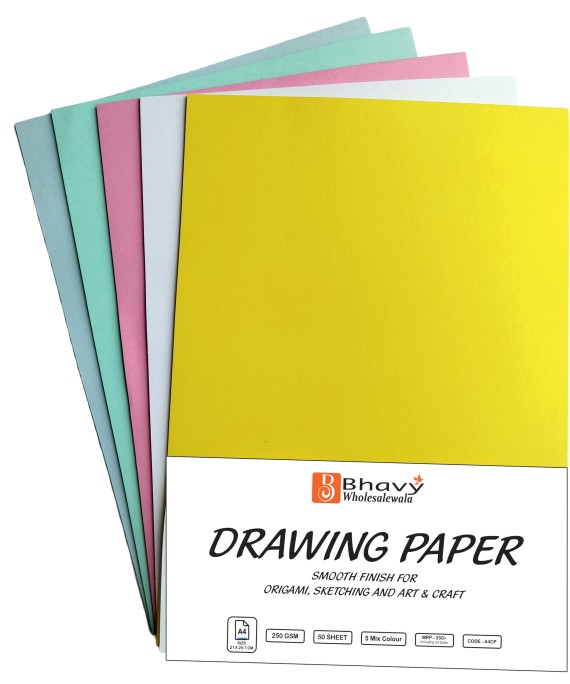
Mix Chart
- In Stock
A Mix Chart typically refers to a visual representation or graphical tool used to display a combination of different data sets, variables, or categories in a single chart. This type of chart is often used to show multiple types of information together, allowing for easy comparison and understanding of how different data points or trends interact with one another. It can combine elements like bar charts, line graphs, and pie charts in a single view, providing a comprehensive overview. Mix charts are commonly used in business presentations, data analysis, and reports to highlight diverse aspects of a situation or process. If you were referring to something else specifically with the term "Mix Chart," feel free to clarify!


